The impact of Covid-19 on 2020/21 tax receipts

Share this article
A review by the House of Commons library released in December 2021 discusses trends in tax over the course of the Covid-19 pandemic.
The coronavirus pandemic meant that 2020/21 was not a typical year in most aspects of life, including tax. In 2020/21, UK government revenues – or public sector current receipts – were £793 billion, 4.3% lower than in 2019/20. Taxes amounted to £706 billion.
Income tax, NICs and VAT contribute a little under three-fifths of all revenues. In 2020/21, £196 billion was raised from income tax, £144 billion from NICs and £117 billion from VAT. Corporation tax was the fourth largest tax, raising £54 billion. Council tax raised around £38 billion and fuel duty raised £21 billion. All other individual taxes each raised less than £20 billion in 2020/21.
Business rates would normally raise over £25 billion but the government gave a business rates holiday to sectors affected by coronavirus-related restrictions in 2020/21.
In aggregate, receipts have fallen as there has been less economic activity and because the government has given tax breaks to support the economy. However, the economy shrank to a greater extent than receipts, so receipts became larger relative to the size of the economy in 2020/21. The financial support that the government provided to protect household incomes – such as the furlough scheme – and support businesses – such as grants – also supported some tax revenues.
What happened to taxes in 2020/21?
Government revenues usually fall during a recession and usually fall slightly faster than the size of the economy. However, during 2020/ 21, revenues fell slower than the economy which meant that revenues became larger relative to the size of the economy in 2020/21, compared with 2019/20. This is despite the government making tax cuts that reduced receipts, such as holidays for business rates and stamp duty and cuts to VAT for the hospitality sector.
Overall, revenues held up relatively well because of the financial support that the government provided to protect household incomes and support businesses. For example, for personal taxes raised from earnings and incomes, wages and salaries grew during 2020/21, despite the fall in economic output, particularly due to the support provided through the furlough scheme.
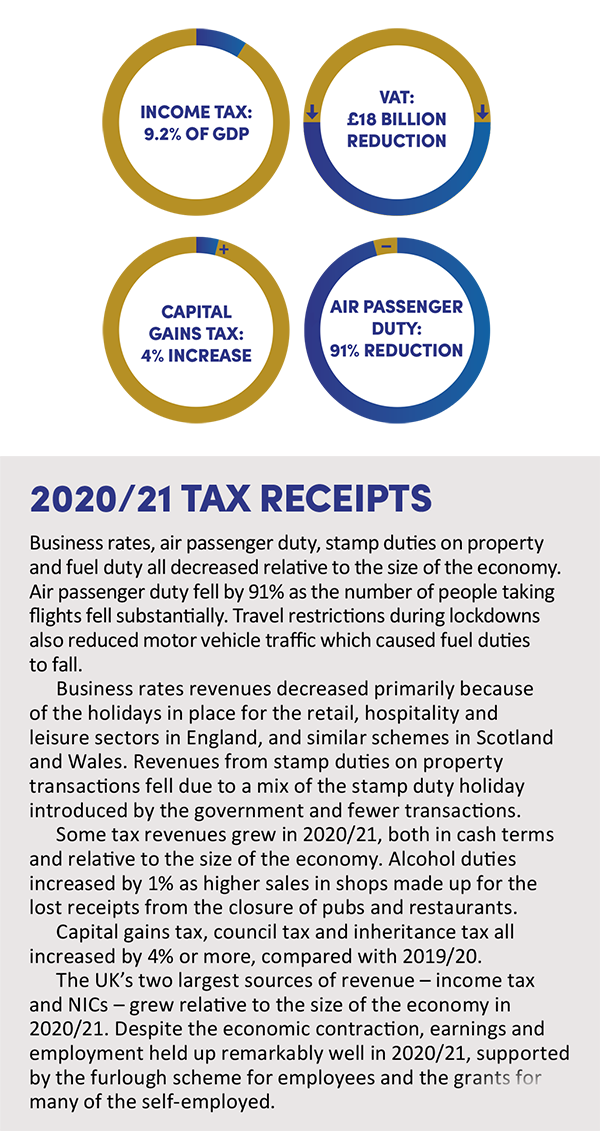
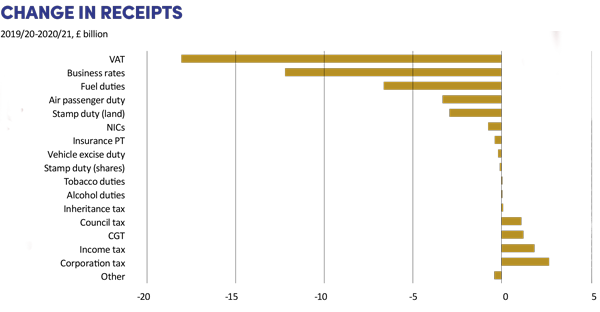
In cash terms, the hardest hit tax in 2020/21 was VAT, where receipts were over £18 billion lower, compared with 2019/20. Consumers have been less able to go out and spend during the pandemic, and government policies, such as cutting VAT from 20% to 5% for the ‘hospitality, accommodation and attractions’ sector, have also affected VAT receipts. VAT revenues were equivalent to 6.0% of GDP in 2019/20 and 5.5% in 2020/21.
Image
Image
Impact of taxes on household income
The Office for National Statistics (ONS) reports on the effects of taxes and benefits on UK household income. Their analysis considers the impact of direct and indirect taxes. There are about 27.8 million households in the UK (see bit.ly/348o52q), of which 7.9 million are a single person; 9.7 million two people; and 10.2 million three or more people (in all cases adults and children).
Direct taxes
In 2019/20, the average household paid £14,100 in direct taxes, equivalent to 23% of gross income. Gross income includes all original income – for example, from earnings and investments – plus cash benefits provided by government – for example from the state pension.
The richest fifth (about 5.6 million households) paid on average £40,900 in direct taxes in 2018/19, which is equivalent to 30% of gross household income. The poorest fifth paid £3,300 in direct taxes, which is equivalent to 17% of gross household income.
Council tax limits the extent to which direct taxes reduce income inequality. Even after including council tax support claimed, the poorest fifth pay a greater proportion of their gross income on council tax than the richest fifth. Research suggests that this is partly due to low take-up of council tax support entitlements.
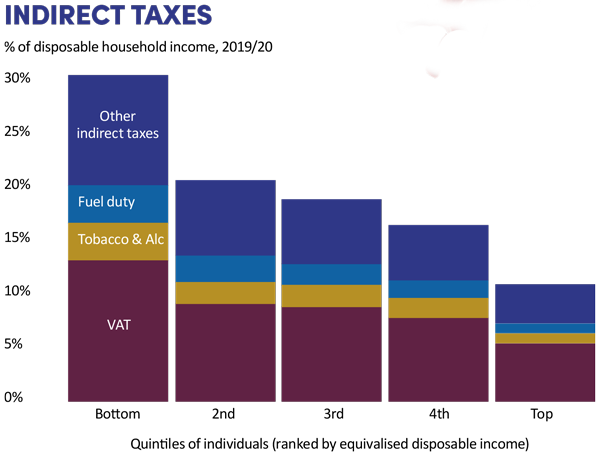
Indirect taxes
When measured relative to household incomes, indirect taxes (around 45% of which are VAT) can be judged to be regressive: that is, those with lower incomes pay more relative to their income. However, when measured relative to household expenditure, indirect taxes are more evenly distributed across individuals.
Changes in composition of taxes over the last decade
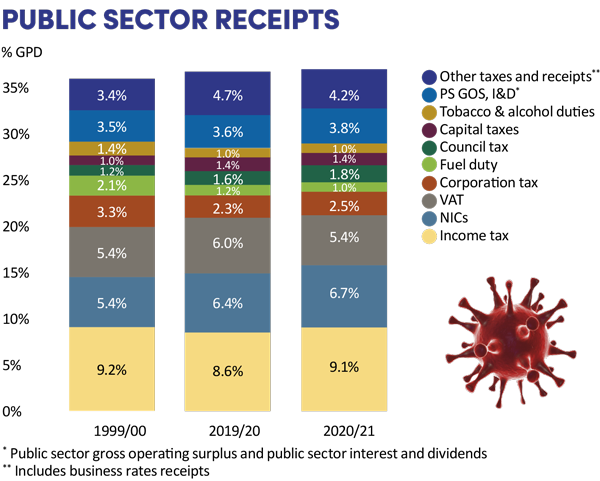
Comparable data on public sector receipts are available from 1999/00. In 1999/00, public sector receipts were equivalent to 36.0% of GDP. Receipts have fluctuated since, but the general trend has been towards receipts growing relative to the size of the economy. In 2019/20, public sector receipts were equivalent to 36.7% of GDP. Receipts have exceeded 36.5% of GDP in each year since 2010/11.
Both VAT and NICs were larger in 2019/20 than they were in 1999/00, relative to the size of the economy. Income tax and corporation tax receipts were relatively smaller than they were in 1999/00.
Since 1999/00, noticeable relative decreases have been seen in fuel duty receipts – a result of improved fuel efficiency and freezes in fuel duty rates – and in tobacco duties.
Council tax has grown in significance since 1999/00. Receipts grew particularly quickly in the years leading up to 2009/10 but have since slowed.
The taxes grouped in the Public Sector Receipts chart on the left as ‘capital taxes’ have grown from 1.1% of GDP in 1999/00 to 1.4% in 2019/20. Receipts for stamp duty on property transactions and capital gains tax have grown faster than the economy over the period. The growth seen in the taxes grouped as ‘other taxes’ has largely come from the introduction of environmental levies and growth in receipts from both air passenger duty and insurance premium tax. Other new taxes introduced since 1999/00 include, the bank levy, the bank surcharge, the apprenticeship levy, diverted profits tax and the digital services tax.
The richest one-fifth paid £10,800 in indirect taxes in 2019/20; the poorest fifth paid £4,800. For the poorest fifth this is equivalent to 30% of disposable household income, but for the richest fifth it is equivalent to 11% of disposable household income.
The Institute for Fiscal Studies has analysed how much households pay in tax. Their analysis – which covers around three quarters of tax revenues (including income tax, NICs, VAT, excise duties and council tax) – found that the 50% of households with the largest incomes contribute around 78% of taxes.
The House of Commons Library ‘Tax statistics: an overview’ (published in December 2021) is available at bit.ly/3KMXDMu